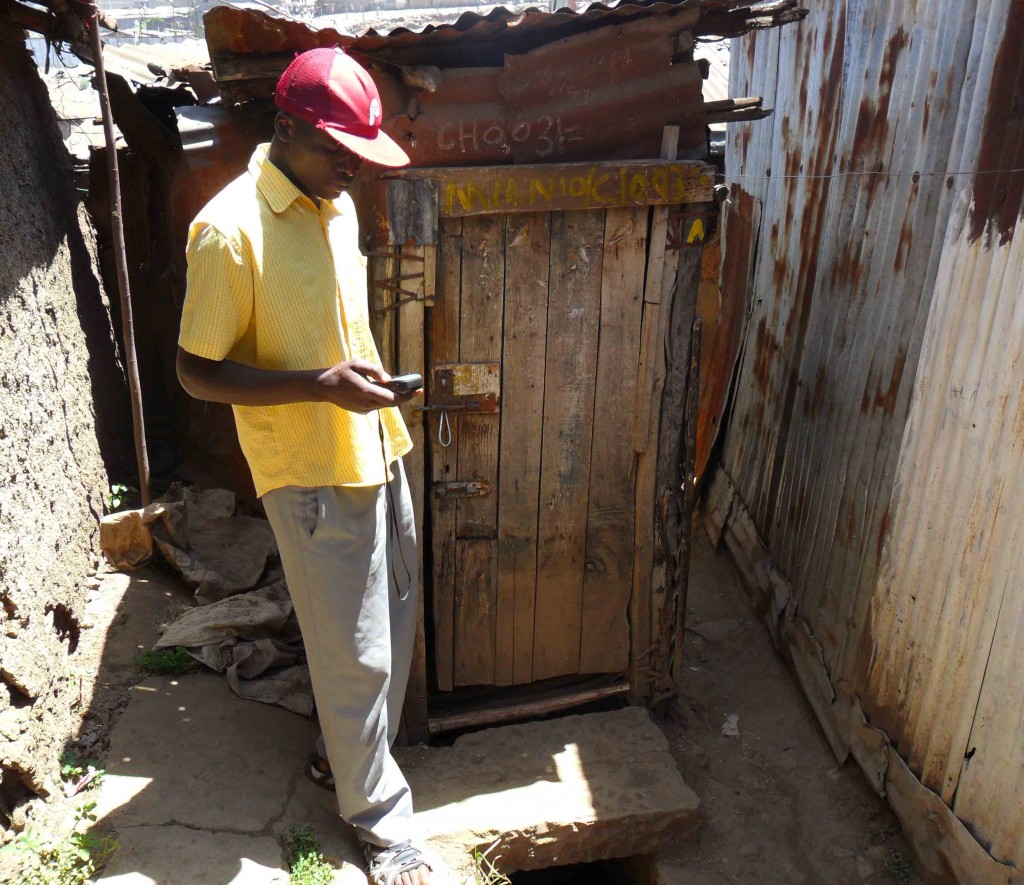
Jackson collecting a point in front of a toilet
The first phase of detailed water and sanitation data collection and editing is over. In two weeks our teams collected and edited 262 points including: 89 points with toilets, 108 water points and 65 open defecation areas.
What we learned from the numbers:
- The smaller number of toilets does not show the real picture as there can be many toilets at one point (we collected the number of units per point, but this is not reflected in the 89 figure).
- The number of open defecation areas is alarmingly high – there is almost the same number of toilet sites as there are open defecation areas – which clearly points to a lack of toilets.
- The number of toilets and water points will likely stay low because of the specific structure of Mathare: half of its buildings are high-rise apartment buildings that usually have toilets and water connections on every floor , which brings us to the next point:
- In order to get the real picture of the water and sanitation in Mathare, we need to figure out how to collect the data from these apartment buildings (it will need to be an inclusive approach, connecting community members, stakeholders, administration, government, etc.)
For the purpose of data editing we used basic mapping features to tag our points as amenities, like toilet and drinking water, and for ODAs we used the tag landuse-landfill. In addition to these basic features we added our own tagging scheme which we created so it coincided with the data collection forms.
There was some confusion here and there because of the massive amount of papers which contained the data of different points (something to think about in the future – how to get rid of the huge stocks of paper), but otherwise the data entry itself went well.
Here’s a detail from OSM showing all three features.
Phase two is already on under way.
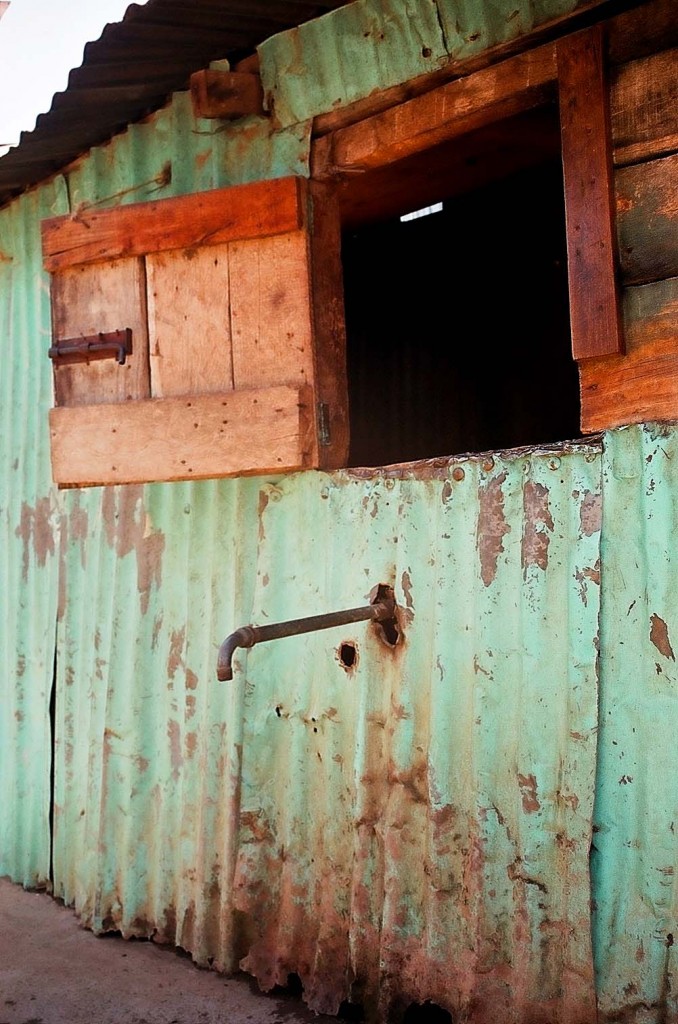
Water point
Although the Ground Truthing of the shapefile which was sent to us by AAAS was done in three days (read more here and here), fixing the shapefile itself took a bit longer. In the process, we created three shapefiles.
The main shapefile contained the closest resemblance to the situation on the ground. Our teams have checked and corrected on the ground the shapes of most of the buildings, written down the types of the buildings, and classified them. From this exercise, 4 attributes were added:
a) Type means the type of building, which is either Brick, Corrugated Iron Sheet, or Wood Stalls
b) Name is name of the building (if it has a name)
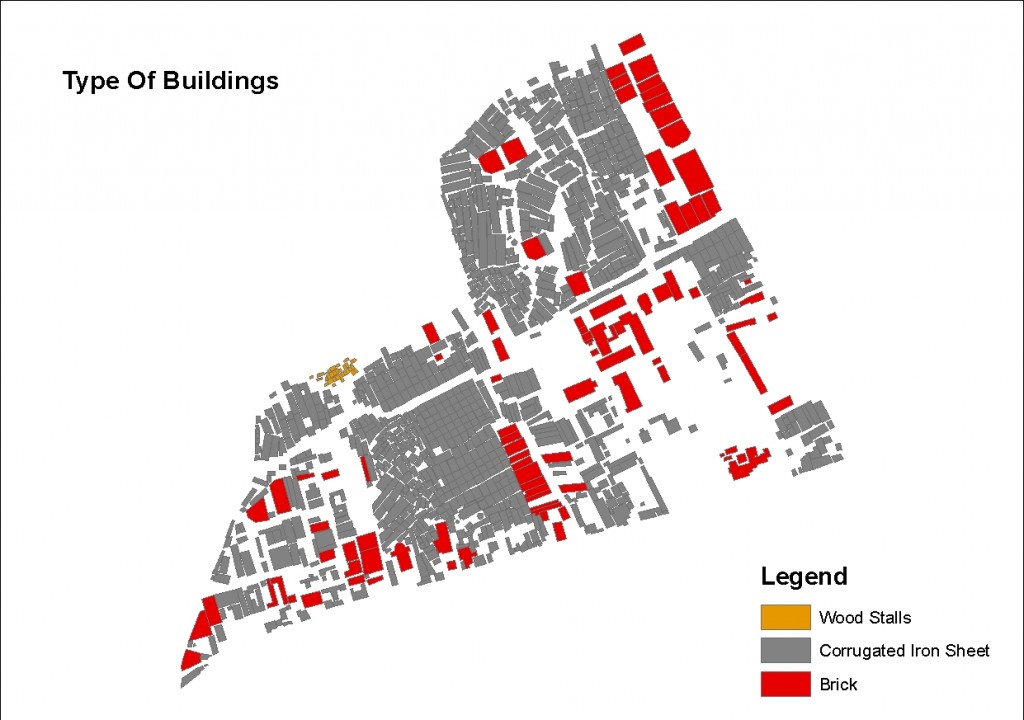
Type of buildings
c) Designated is the designated use of the building, describing what the building is used for. It can be many things, including: school, house, business (like bar, cyber cafe, garage, hardware shop, market place, etc.), church, toilet, etc.
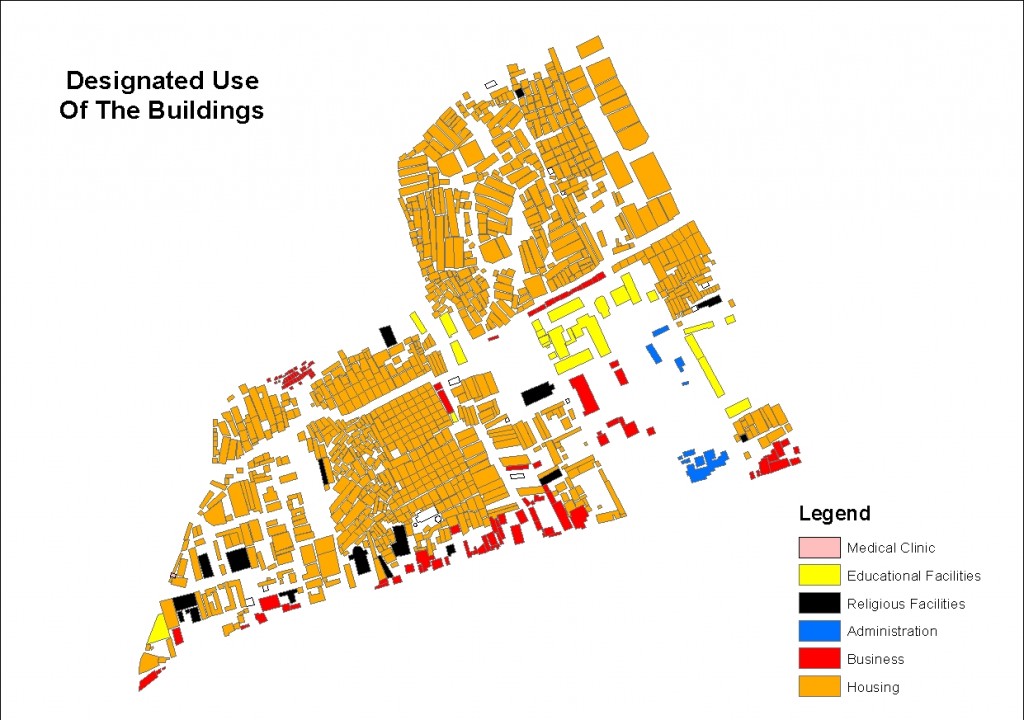
Designated use of the buildings
d) Action is what kind of action was carried out on the shape of the building – there are two options: 1) Added if the building was missing and was added and 2) Modified if the building was either moved, merged, or in any other was modified
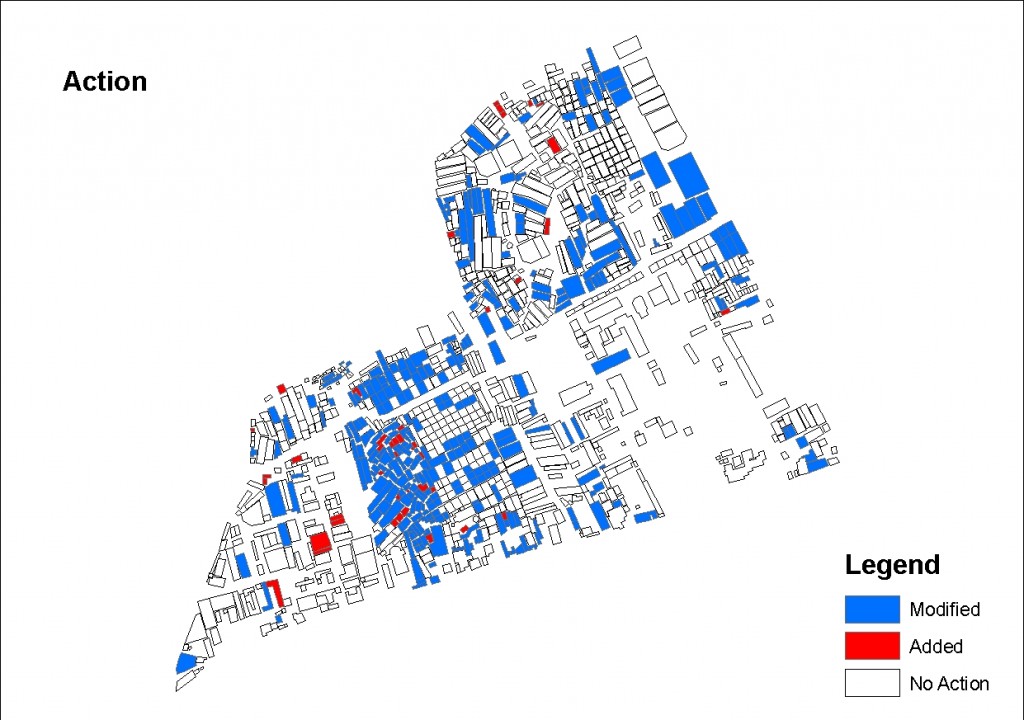
Action performed
Many times in the slums you see corrugated iron sheet houses build on top of brick houses. We’ve identified these structures in the second shapefile called Buildings On Top.
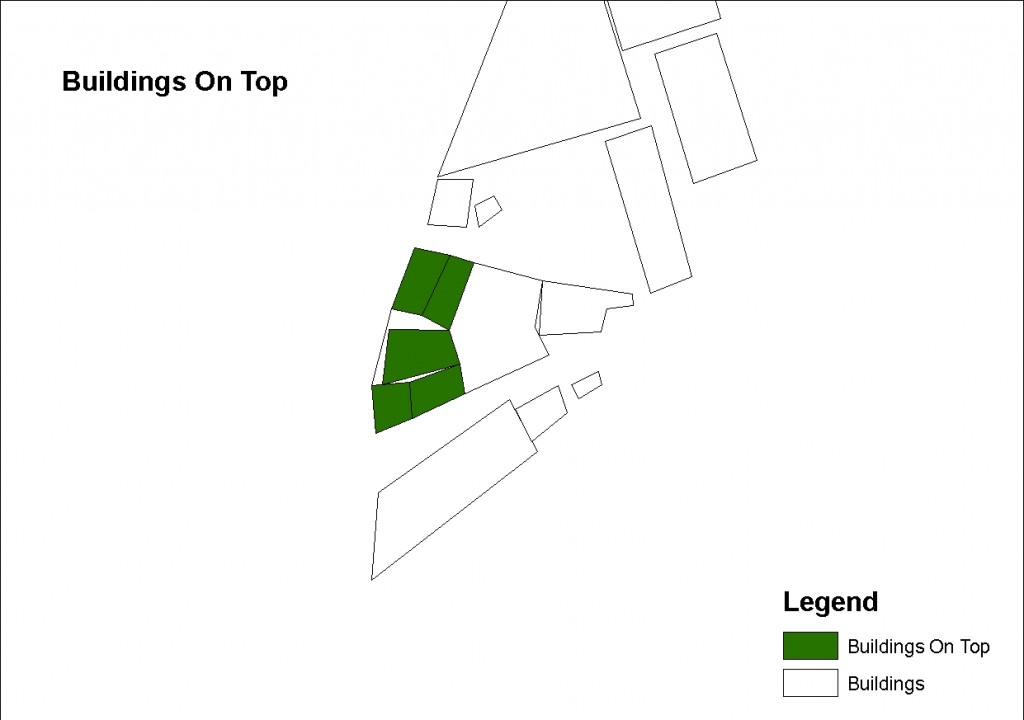
Corrugated iron sheet buildings on top of brick buildings
The third shapefile contains deleted shapes (buildings) because they are either not there, are incorrect (there are many shapes representing one building), or don’t represent permanent structures (like temporary tents in the Chief’s camp).
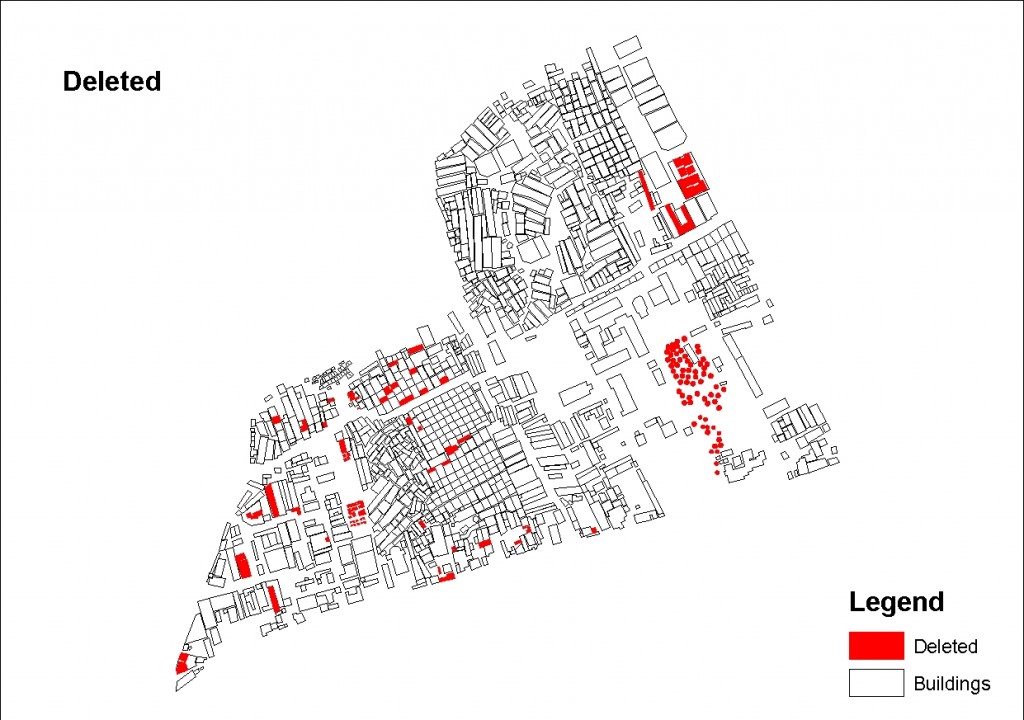
Deleted objects
Our teams have collected around 750 points in the first run of data collection and are now it the second phase of detailed Water and Sanitation data collection. The idea is to eventually attach the points they collect to building extraction for the whole of Mathare.

Attaching points to buildings
More of the same on: Mapping: No Big Deal
Our teams have started with comprehensive thematic mapping of Water and Sanitation. Most of the things that we set out to map, such as water points and toilets, were pretty straightforward, but there were also some unknowns – like open defecation areas.
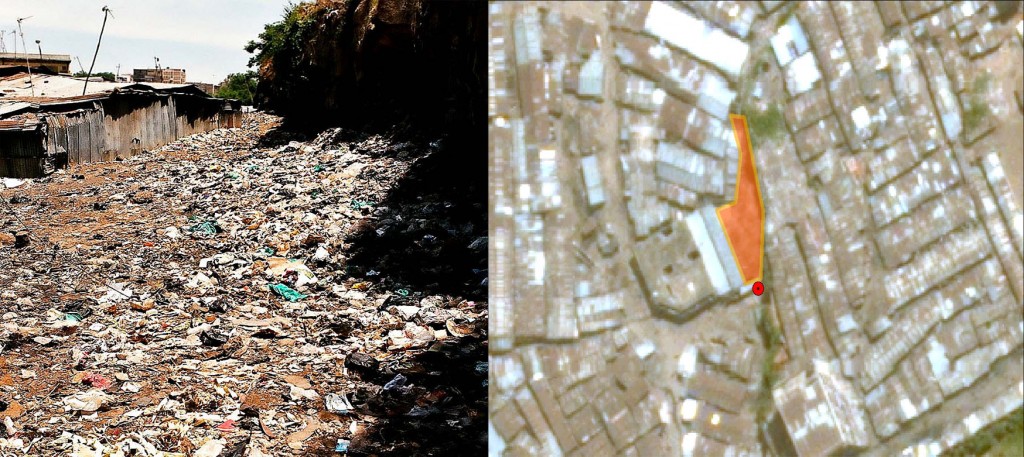
What is an open defecation area (ODA)? This is an area which is used by people to relieve themselves where there aren’t enough toilets for all or where people can’t afford to pay to use the toilet (more about it here). These areas are usually also dumping sites for “flying toilets†and other garbage, but mostly for excrement. People use them either early in the morning or late at night so others can’t see them.
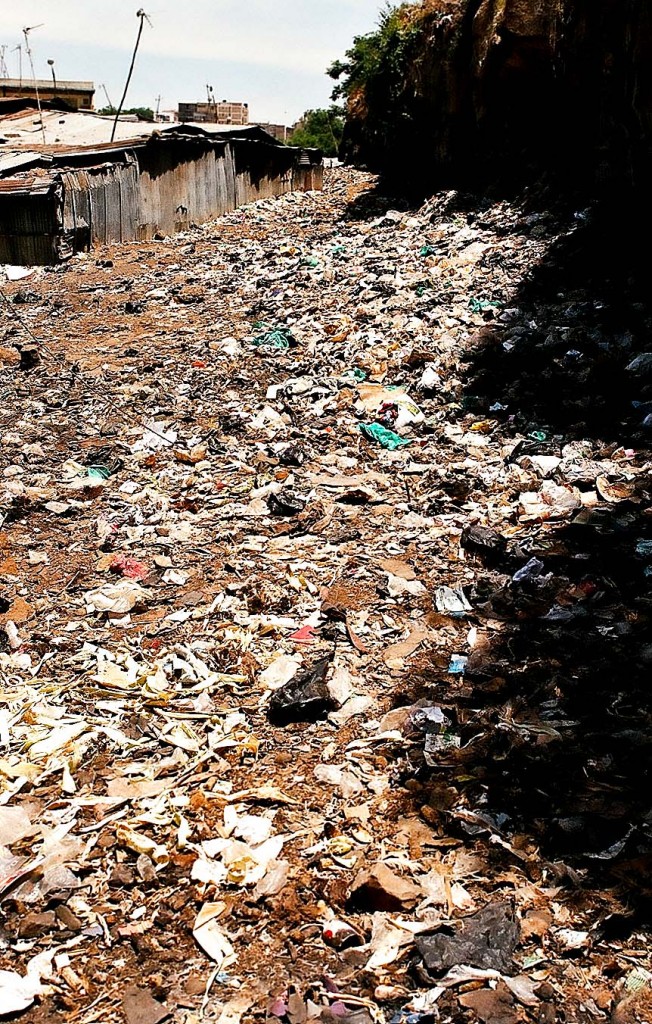
Open defecation area
We didn’t realize that this is such a big problem until we saw it with our own eyes. They are a huge health risk because they are usually situated in the middle of a very populated area and it is not an uncommon sight to see children playing near or even on top of them. They are also an indicator that something is terribly wrong with sanitation (especially toilets) in the slum.
So how do we map these areas? The first idea was to stand in the middle of the area and collect a point. We dismissed the idea as soon as we saw the expanse and the state of these areas. Most of our mappers come in flip flops and aren’t well equipped to walk there. So we decided we’re going to take a point near the ODAs, later search for the point with the help of satellite imagery and digitize the area. This way we’ll learn different techniques in mapping, get the exact area (in square meters) of all of the ODAs and therefore the whole area in Mathare which is covered by them.
Below are two examples:

Mapping open defecation areas
Mapping open defecation areas


