by: jamie February 17th, 2011 comments:
This is an article prepared by Douglas Namale and published in February 2011 edition of the Kibera Journal. Douglas is a journalist and Editor of the Kibera Journal. He joined Map Kibera in November 2009 to continue contributing to the creation of community information. The article has been posted here with his permission.
—
By Douglas Namale
Melinda Gates has added her voice on the significance of having a map in Kibera as a tool for development.
‘When you map where you stay, it marks the beginning of development’ said Melinda as she addressed delegates at TEDx for Change at Kibera Mchanganyiko hall. She said it’s vital to know how many people live around you since this will form the beginning of lobbying for change. According to her, the mapping project has necessitated many things which majority couldn’t understand without a map.
“Its absurd to note that for many years Kibera has appeared on the map as a forest, till the mapping project which has now revealed different facilities present in Kibera,†she added.
Other delegates voiced their interest in seeing Kibera change. Governance Consultant John Githongo said it’s vital for the state to recognize and value the dignity of its citizenry other than leaving them to despair. Githongo noted that Kenya was quickly turning into a very weak nation polarized by cultural differences and ethnicity something that rendered wananchi vagabonds in their own country.
Bad governance was pointed out as the reason behind the sprawling slums with little attention given to the inhabitants. Salim Mohamed, a budding youth leader and co- founder of Carolina for Kibera blamed NGOs rivalries as one of the reasons behind little development despite 534 NGOs working in Kibera. He pointed out international economic order as a solution to the proliferation of CBOs and NGOs doing almost nothing, despite billions of dollars spent to improve the living standard of people living in Kibera. Mohamed said there was need for NGOs to work together and support each other for any meaningful change to be realized. His sentiments were echoed by Umande Trust CEO, Josiah Omotto. Omotto added that true partnerships and sharing of information will help to mitigate key issues bedeviling the Nairobi slum. He too pointed on bad governance, corruption and lack of transparency and accountability as factors leading to the spread of the slum.
Map Kibera has just embarked on the use of the map to develop the Kibera slum. Already, the team has started up a conversation with the City Council of Nairobi and Kibera Councilors on the need to identify map and name the roads in Kibera. This will make sure that the slum is accessible during emergencies like fire and sickness.
Already, some progress has been made. Among the five councilors representing Kibera at city hall, four have already showed interest and one has already linked us with District commissioner’s office and another NGO interested in building sanitation blocks in Kibera.
by: primoz February 16th, 2011 comments:
The American Association for Advancement of Science (AAAS) donated us a WorldView-2 image (read more) with 6% cloud cover, taken on 30th of June 2010. It covers the areas of Mathare Valley, Korogocho, Kariobangi, Baba Dogo, as well as part of Kasarani, Dandora, and some surrounding areas. Altogether, the imagery is of a broader eastern part of Nairobi, containing the areas with the highest concentration of people in the city.
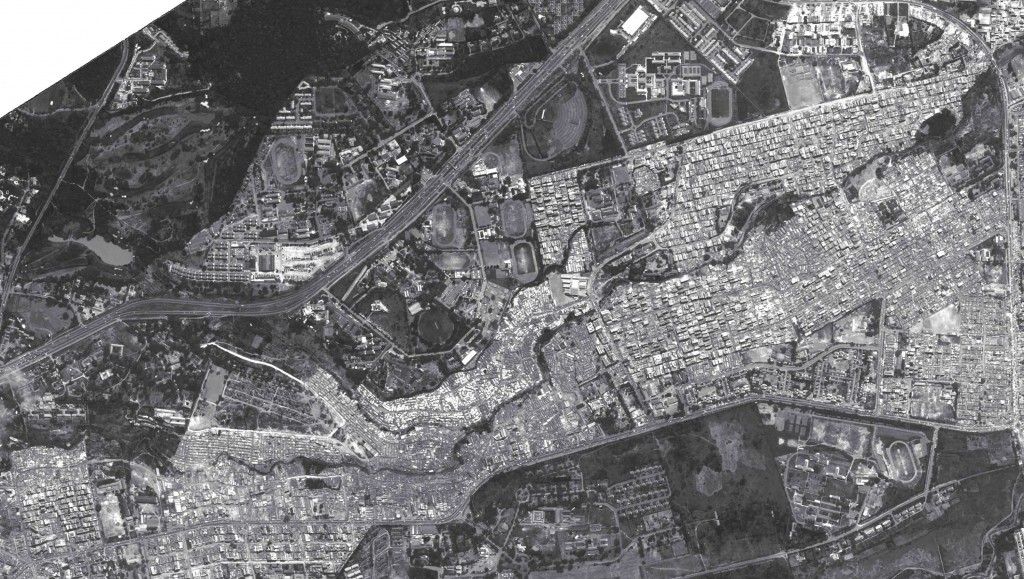
Satellite image of Mathare
The image is of course useful in numerous ways, but the first thing we want to use the image for is to create a building extract for the whole area of Mathare! The AAAS showed a great interest in helping us with this issue and is indeed helping us now. The deal was that we set out a test region to begin with so one of their analysts could analyze that area. We would then take a look at it and go to the field to ground check their mapping. If that worked out satisfactorily, they would expand the extraction further to do the whole area.
As said, we first set out the test region for them to analyze. Our focus was on Mathare 10, Thayu, Mabatini, and Mashimoni. We picked the area because it is situated very centrally in Mathare, has different variety of buildings (tin and brick) and is also an interest area of our partners, Plan Kenya and CCS. A day after the area was set we got the first results – the first automated building extract of the area.
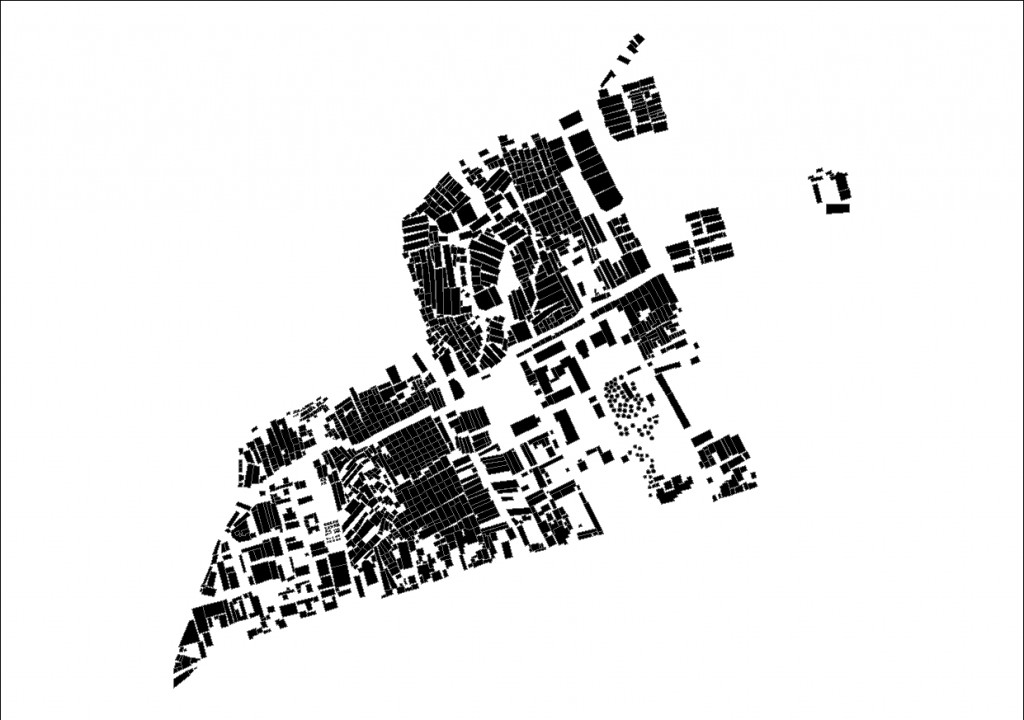
Building extraction on a test area
A quick look already revealed some of the faultinesses of the automated process like overlaying shapes, crooked shapes of objects, shattered uniform objects and merged diverse objects, digitized/mapped non-existing objects, etc.
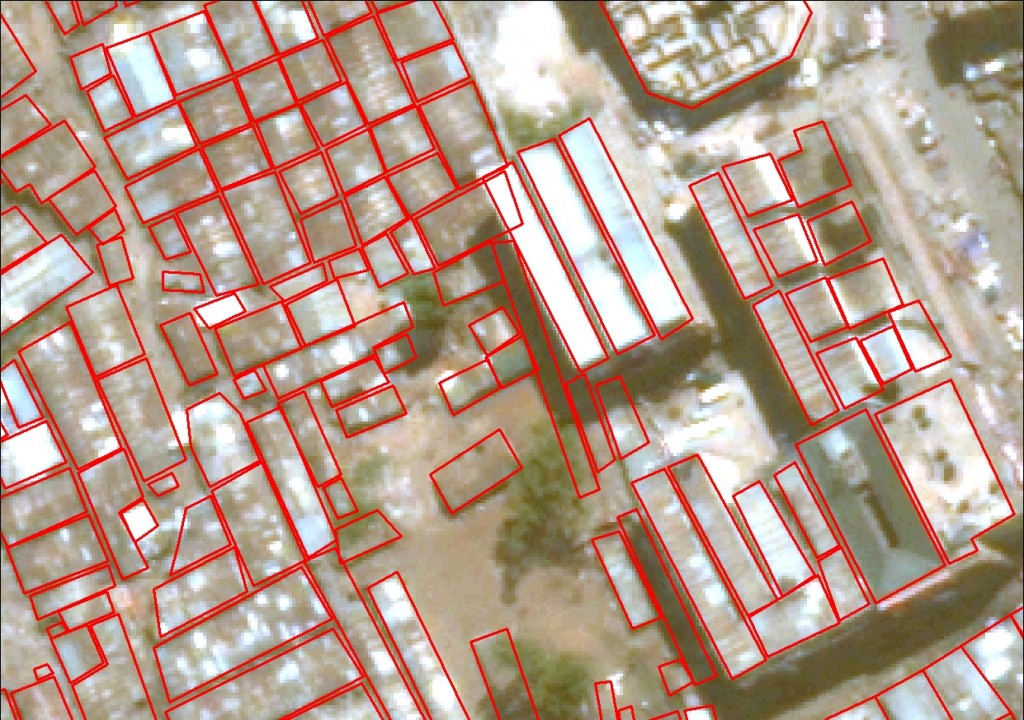
Some of the faultinesses of the automated process
Our next “jobâ€, which is currently under way, is ground truth-ing the results. This basically means checking every object in the field and comparing it to the created extracts, than confirming or rejecting certain objects, classifying them, repairing the shape files, digitizing collected (repaired) information and sending it back so they can reset their algorithms.
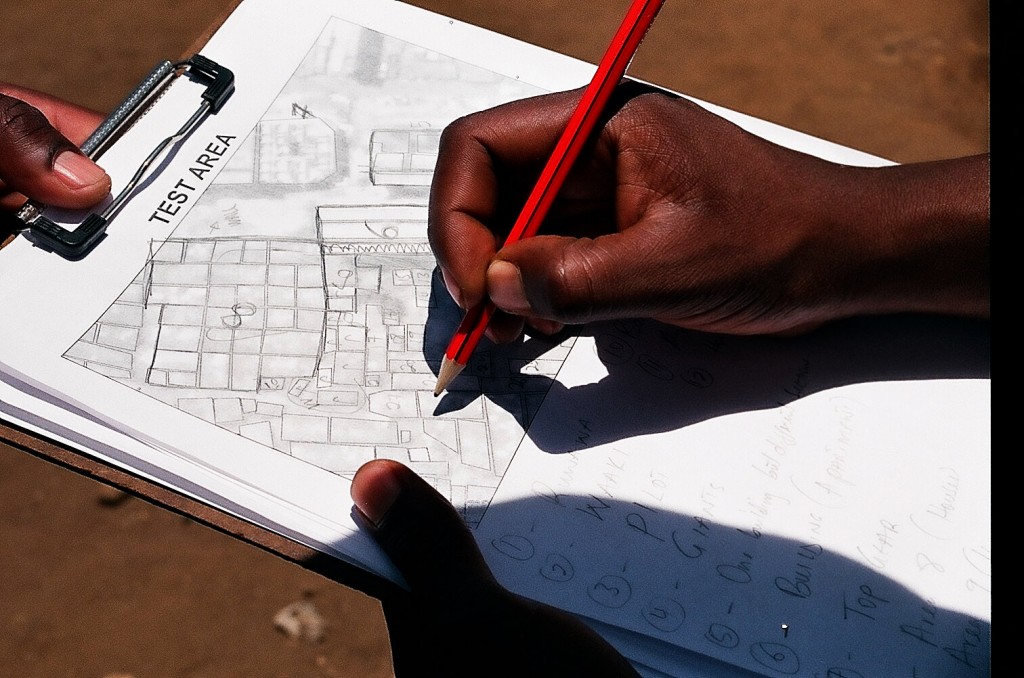
Ground Truthing
The biggest challenge is how do we do that practically with limited equipment and resources? We knew from the start that we’ll get the best results if the people who come from the area are the ones ground truth-ing their own area. This is also important because this kind of work basically takes you into the compounds and backyards of houses and you obviously don’t want strangers walking on other people’s backyards.
For the purpose of data collection I created forms, printed them out, bought some pencils, sharpeners and erasers and called Francis and Jackson from Mashimoni to take me around their neighborhoods and give me the feedback – they are two of the mappers who will be the ones leading the project on the ground later, which is why their opinion is crucial.
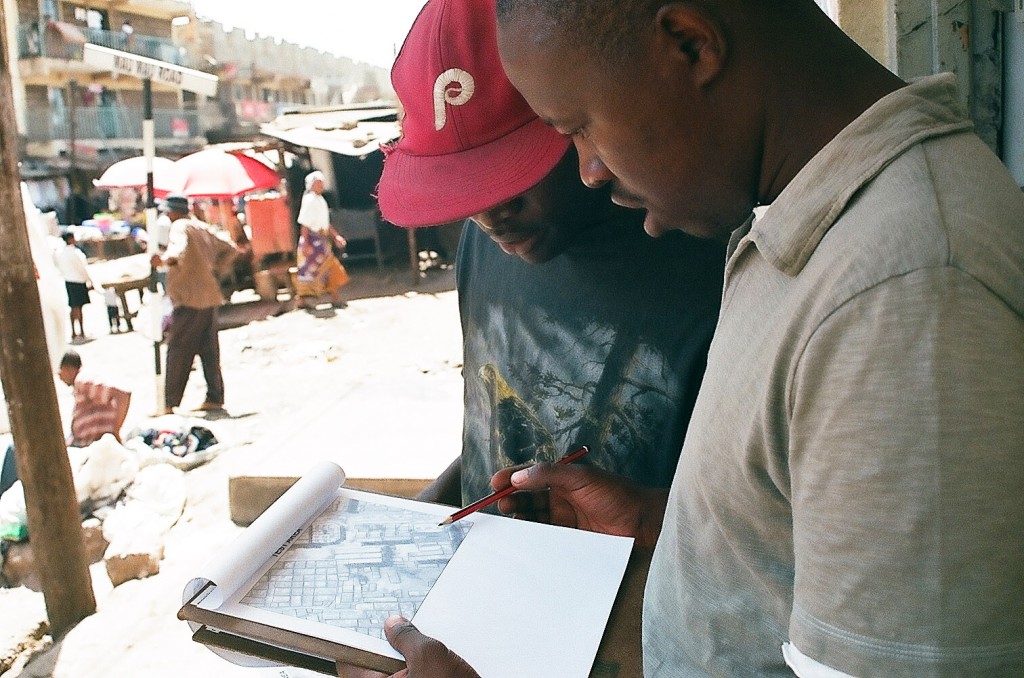
Francis and Jackson in action
During the exercise we focused on specifics like:
- We numbered each house in the test area, classified them and added different types of buildings (tin, brick, etc.)
- We repaired shapes of the buildings extracted
- We deleted redundant shape files
- We wrote down names of all known landmarks
The guys also gave me feedback regarding the forms:
- Prepare a bigger map of the whole test area and outline the smaller area on it for better recognition of the area
- Add names of the roads to the forms for better recognition of the area
- Make darker outlines of extracted buildings on the forms
- Add names of landmarks for better recognition of the area
After the ground truth-ing of the area the AAAS will (hopefully) expand the extraction to the whole of Mathare. And then the fun really begins!
by: primoz February 14th, 2011 comments:
We’ve completed the base map of Mathare. It took us 17 days during which 15 mappers (on average each day) would map and edit for an average of 5 hours per day. That accumulates up to 1250 man hours. Of course the exact figure of man hours is much lower mainly due to a limited number of computers and equipment which resulted in many of the mappers just strolling along or observing the creation of the map from afar. We have mechanisms prepared for this type of instance, as we want everybody interested to learn and contribute. One of these mechanisms, which we implemented in the last two weeks of mapping, is rotating venues.
If I throw some statistics at you, the base map has – or, if I put it differently, mappers have collected, edited and digitized:
- 750 points
- 41.3 km of roads and paths
- 24 Mathare villages digitized, altogether an area of 3006444 m2 3.0064444 km2
- 138 buildings digitized, altogether an area of 58322 m2 or 0.058322 km2
- Other areas digitized (walled areas, fields, football and recreational pitches, natural areas, etc.)comprise 360602 m2 0.360602018 km2
Below is the base map where the first map (Map 1) presents only the points collected and the second map (Map 2) presents the types of resources collected (represented by points), such as hospitals, toilets, water points, schools, religious institutions, etc.
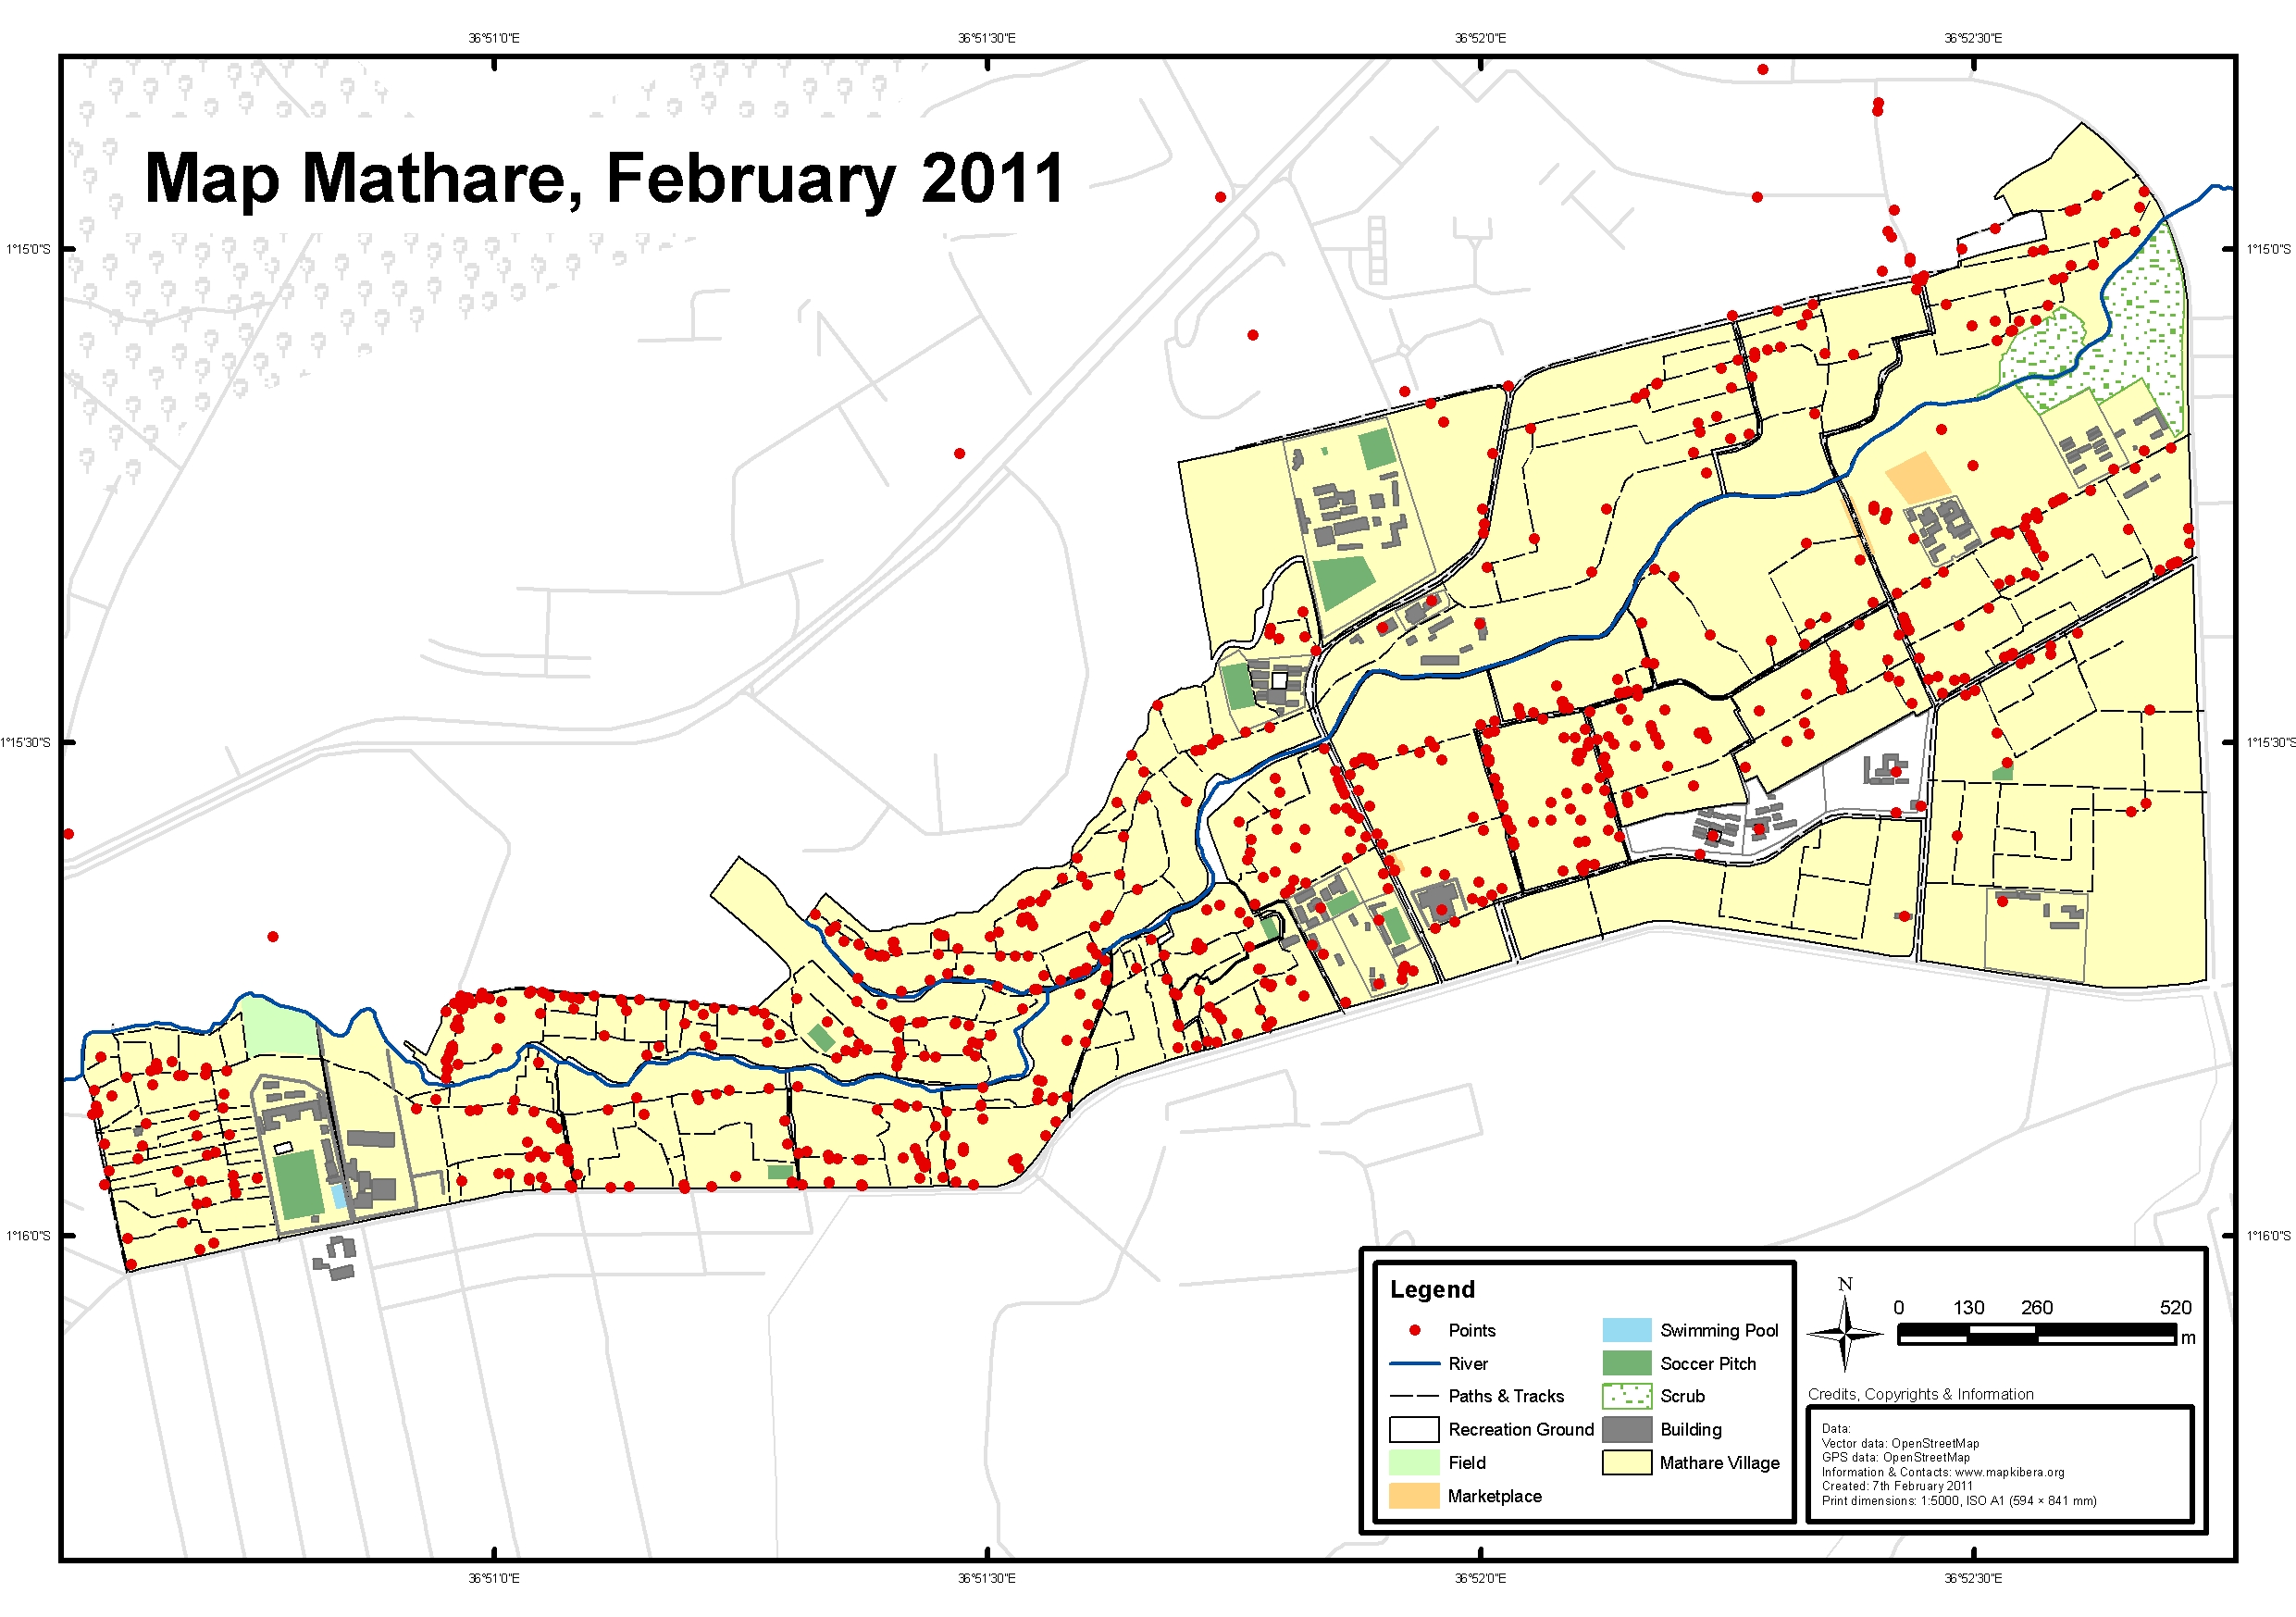
Map 1
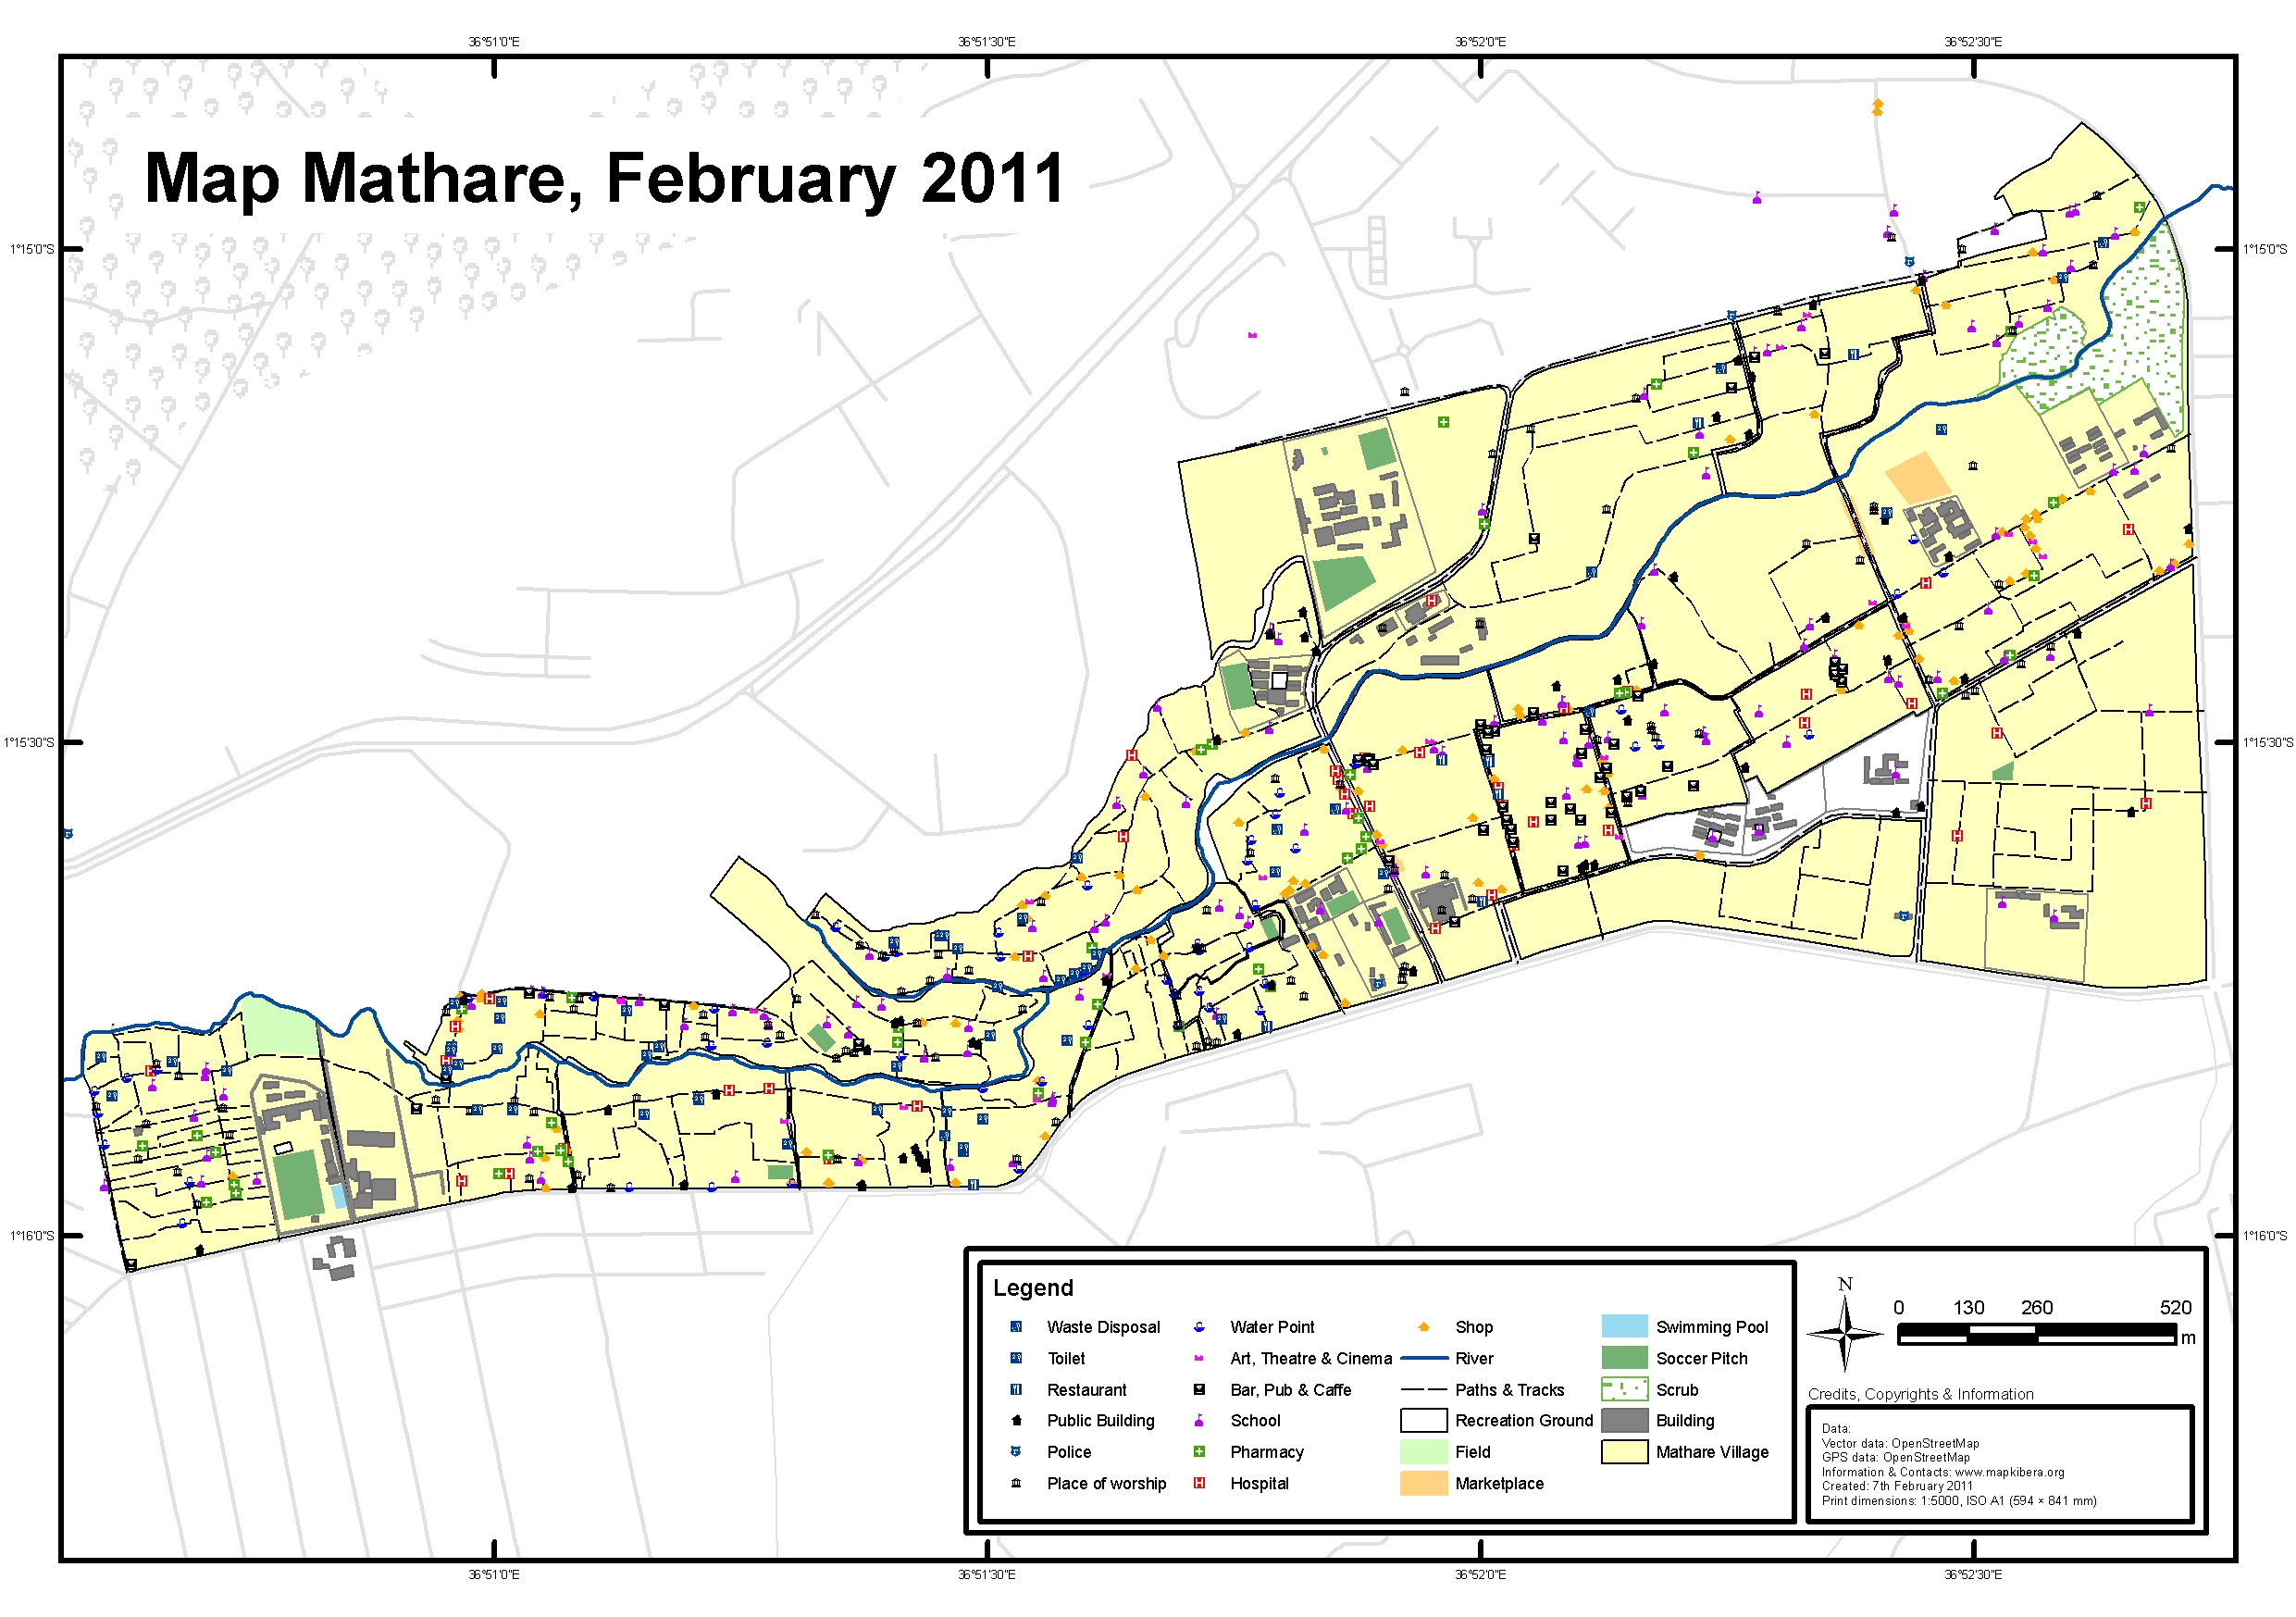
Map 2


